
Geographic Analysis Drives Business Results
/Red Comma is passionate about analysis and media planning. A key part of this process is synthesizing geographic data to define opportunities that align with brand objectives. Here are a few examples of this work in action, driving significant insights that impact the bottom line. Links to the mini-cases below:
HVAC: Zip targeting drove market growth
HVAC: Zip targeting drove market growth
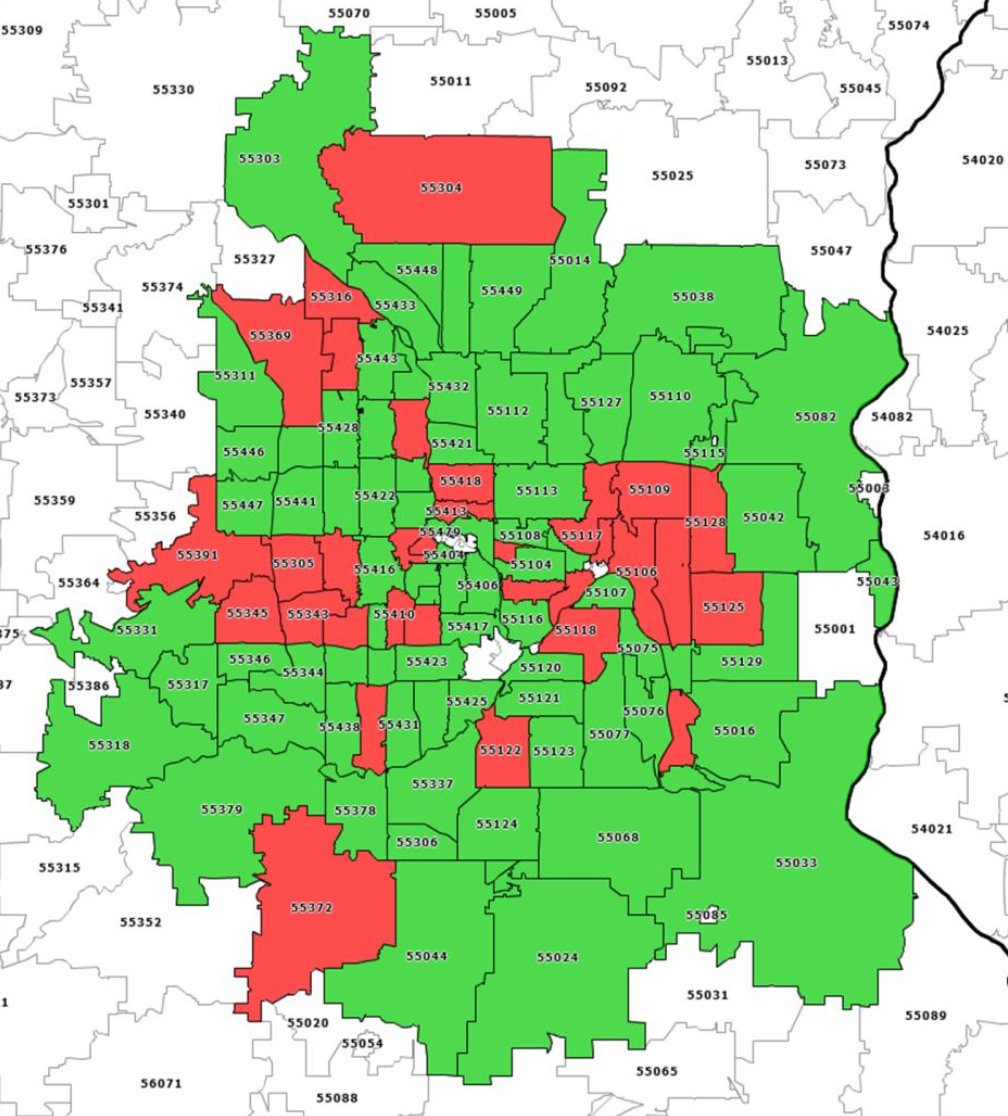
We conducted a robust geographic analysis that brought clarity to spend allocations during planning and enabled post-campaign results tracking that showed growth in the targeted zips. Red Comma analyzed sales data in-house to evaluate success versus relying on proxy digital metrics.
Background: This HVAC, plumbing and electrical provider had a long history in the community and glowing consumer reviews, but was outspent by competition and needed help focusing their upper-funnel spend to the most productive channels and neighborhoods.
Data Sources:
Client-provided current and historical sales by zip code
US Census populations, median home value and home age by zip code
MRI-Simmons audience profile that linked home value and home age to propensity for hiring out improvement activities
Analysis: Zips were grouped into segments for “spend to business” and “spend to opportunity” goals. This helped inform planning discussions and budget allocation among the priority regions initially for Outdoor and in subsequent years for CTV.
Results:
Red Comma analyzed client-provided sales data to asses campaign impact.
The OOH plan delivered growth to both the targeted zips and the full DMA.
OOH placements on main highways provided broad exposure which likely helped grow the DMA as a whole.
Shifting the CTV buy from covering the full DMA to just targeted zips improved campaign efficiency; sales results pending client release of this year’s data.
Retailer: Tiered market segments help deliver strong sales
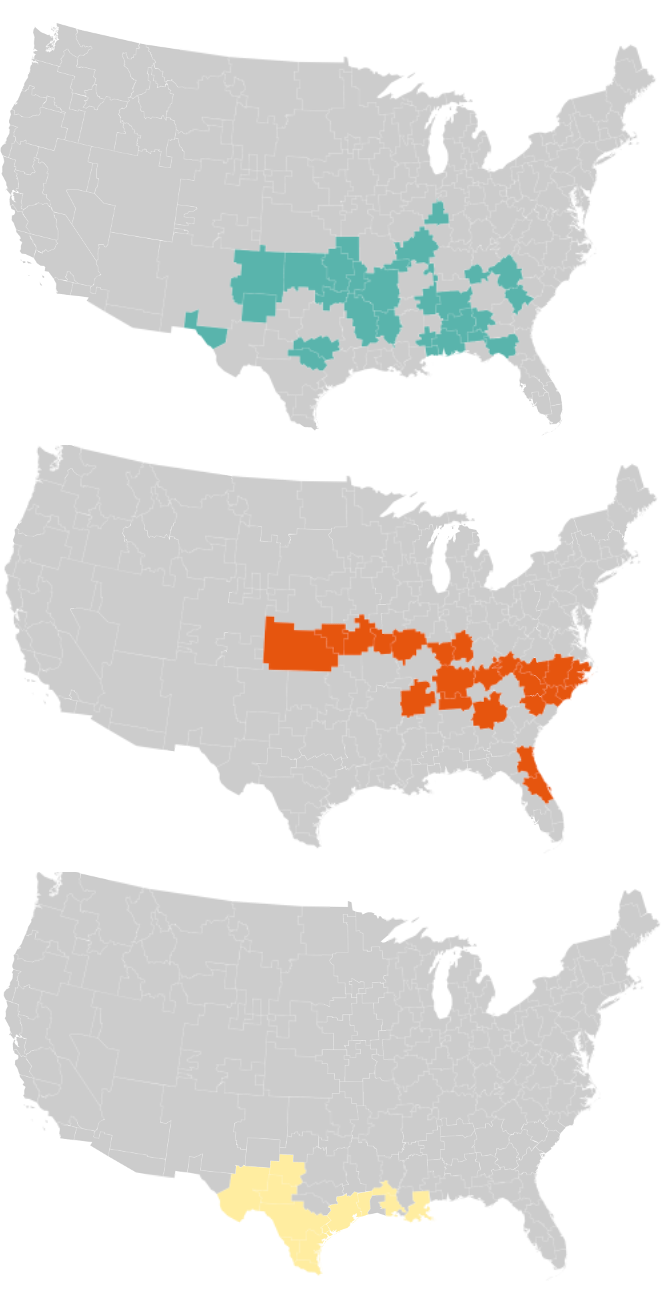
We developed a new geographic approach that allocated funds to markets that had been unsupported for several years. Consistent with reach-based planning principles, delivery was reduced in some geographies so a broader target footprint could be exposed at least once to the message during key seasons. These media plan changes helped the client achieve their best sales year in company history.
Background: A regional retailer with over 200 locations needed to revisit their local media plans as part of planning for the new fiscal year. The prior agency had spent heavily in some markets while leaving others unsupported in traditional media.
Data Sources:
Sales and historical support by DMA
Aided & unaided awareness by DMA
SQAD media pricing and Nielsen target universe estimates by DMA
Analysis: DMAs were analyzed and segmented based on current sales (to make sure we protected key markets) and awareness (to make sure we spent more in markets with low brand recall).
Results:
Media budgets were flat vs. YA, so several plan scenarios were considered before finalizing an approach that supported all markets while ensuring appropriate coverage of the strongest performance DMAs.
While many factors went into the company’s success, they posted “the most profitable year in the company’s history” and “double-digit sales growth in all of its major merchandise divisions” according to trade media articles.
Client marketing contacts believe that the geographic re-alignment played a key role in delivering those strong sales results.
Higher Ed: Inquiry mapping provides OOH focus
We analyzed enrollment inquiries on a regular basis for a long-standing education client to ensure traditional media elements like Outdoor and local cable TV zones aligned with key opportunity areas.
Background: University advertiser was consistently out-spent in the category by competitors with national media plans, so our local traditional media dollars had to be highly focused and productive.
Data Source: Enrollment inquiry data points with geographic identifier
Analysis: Every quarter during media planning, inventory locations were aligned with the most recent inquiry heat maps to ensure media plan impressions were reaching areas that showed the highest propensity for interest in the school’s programs.
Results:
Between 2017 and 2020 our client’s enrollments grew by 5.5% when the category declined by -3.9%, representing a 9.4% gap in performance.
